The atmosphere,
anywhere you need it.
Professional Skew-T diagrams, hodographs, and sounding indices — built natively for iPhone, iPad, and Mac.
Features
Everything you need, nothing you don't.
-
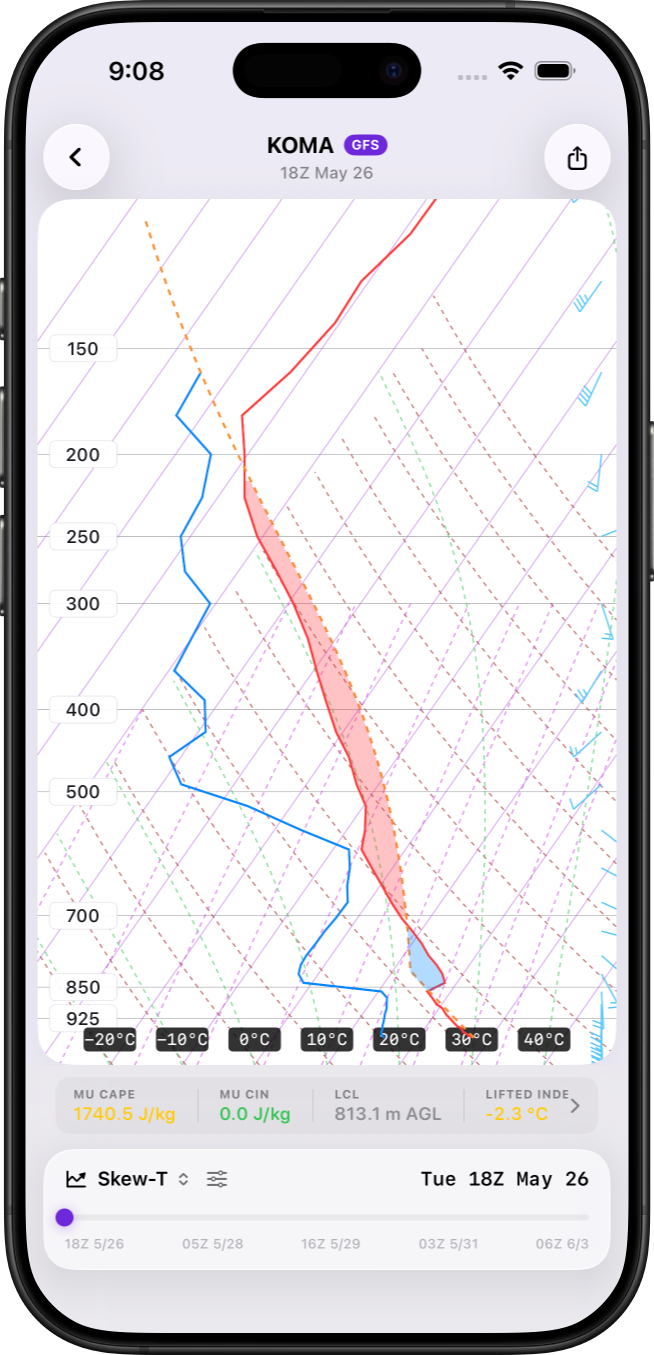
Skew-T / Log-P
Interactive thermodynamic diagrams with temperature and dewpoint profiles. Pinch to zoom, tap for exact values at any level.
-
Hodograph
Visualize wind shear, helicity, and storm motion with storm-relative vectors and left/right mover calculations.
-
Sounding Indices
CAPE, CIN, LI, K-Index, Total Totals, Showalter, and more — with color-coded severity levels.
-
Time-Height Sections
Contoured cross-sections showing temperature, dewpoint, humidity, and winds evolving through forecast hours.
-
Station Map & Custom Locations
Find nearby ASOS and NWS stations on an interactive map, or create custom virtual stations. 1 free auto-fetch station included.
-
Universal Import
Import standard forecast profiles (BUFKIT) from local files, email, or direct URLs. 5 free imports included.
-
Background Auto-Fetch
Always have the latest data waiting. Sondex silently refreshes your pinned stations in the background.
-
Dark Mode & Themes
Engineered for every environment. Switch between Light and Dark modes, or choose from premium color themes.
Charts
Twelve ways to read the sky.
A full suite of atmospheric charts, all available right in the app.
- Skew-T / Log-P
- Hodograph
- Time-Height Section
- Moisture Potential
- Apparent Temperature
- Stability Indices
- CAPE-Shear
- Precip Type
- Accumulation
- Bourgouin Energy
- Mixing Height
- Ensemble Plumes